

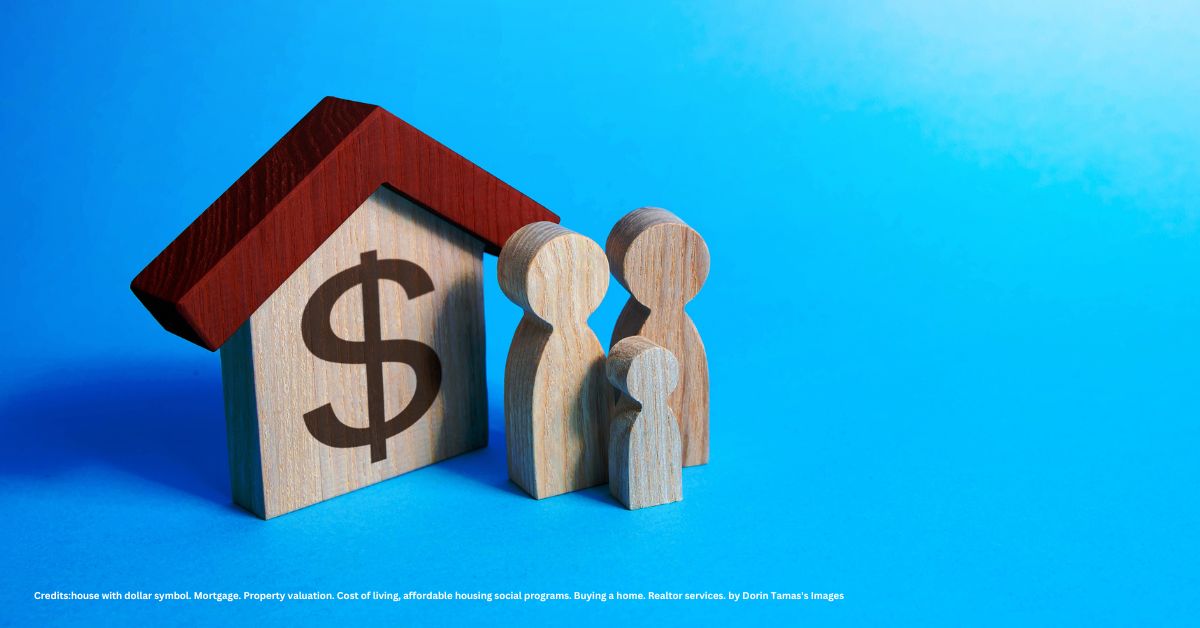
The recently released Census data shows that more Australians are renting than ever before, with rents increasing at twice the rate of inflation, and leaving more people in rent stress.
Victoria’s peak body for homelessness says the housing crisis is driving increased rates of homelessness, as low income renters are pushed out of the market.
“As housing prices have skyrocketed, more Australians are forced to rent long term, creating greater competition and squeezing low-income renters out of the market and into homelessness,” said Jenny Smith, CEO, Council to Homeless Persons.
“For a Newstart recipient receiving $268/week plus Commonwealth Rent Assistance, there are almost no affordable rental options in metro Melbourne, meaning they’re increasingly finding themselves in rooming houses and other forms of marginal accommodation,” said Smith.
The Census data shows that there has been a 10 per cent increase in the number of households paying more than 30 per cent of their income on rent.
“Rents are rising faster than incomes and people on low incomes are forced to skimp on the basics just to put a roof over their heads, or fall into rent arrears and lose their home,” said Smith.
Median rents in Melbourne have risen from $300/week in 2011 to $350/week in 2016, the Census showed. Disturbingly, the number of unoccupied dwellings has also risen, pointing to the trend of landlords sitting on vacant investment properties for capital gain.
“This is yet further evidence of the Federal Government’s failed approach to housing policy and housing taxation. We need action to stem the ravaging impact of the housing affordability crisis.”
Table: Census data 2011 vs 2016
| 2011 | 2016 | |
| Median Rent | $277 ($300 Melb) | $325 ($350 Melb) |
| Renting households | 26.5% | 28.7% |
| Unoccupied dwellings | 11.3% (9.0% Melb) | 11.7% (9.6% Melb) |
| Renters paying more than 30% income | 9.1% | 10.4% |
Top reasons people seek help from homeless services


